By insideSail
Automated technical check · version 2 ·
Models, ensembles and uncertainty
Resolution, spread and probability are not synonyms for certainty.
In this guide
A numerical model represents processes through equations, a grid and approximations. Its initial condition is an estimate supported by observations and analysis.
Calculation produces a possible evolution within that representation. Even correctly executed processing can be affected by incomplete observations, initial errors and unresolved processes.
A forecast is not a recording of the future atmosphere.
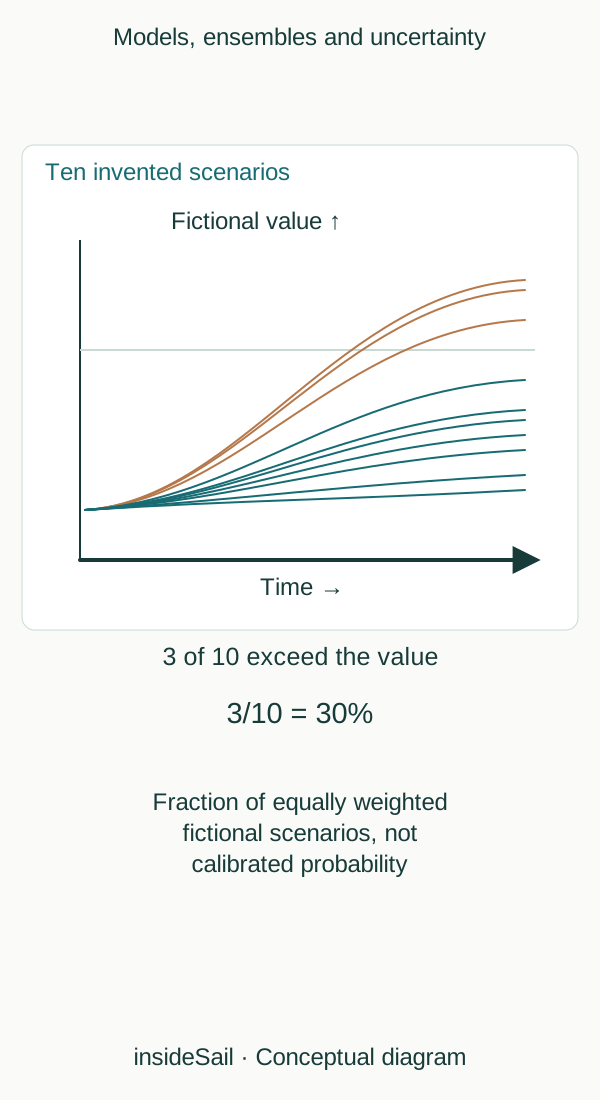
Conceptual schematic not to scale; no local forecast or operational decision.
insideSailOriginal insideSail artwork — all rights reservedEnlarge the diagram
Several possible developments
An ensemble combines calculations exploring differences in initial conditions and/or model representation. Members may remain close or diverge depending on the situation.
Spread helps describe possibilities and predictability rather than directly measuring every possible error. Members share methods and can have common errors.
Agreement does not guarantee occurrence.
Ensemble mean can hide different scenarios. If five members place a frontal passage in the morning and five in the afternoon, the time average is not necessarily a representative scenario.
Percentiles and probabilities summarise distributions but require product definitions. “Exceedance probability” and “mean value” answer different questions even when they share a graph.
A finer grid may represent certain structures better without removing initial errors or all sub-grid processes. File decimal precision does not measure confidence either.
Model comparison requires compatible times, variables, levels and methods; several services can distribute results from one origin. The planning lesson relates these products to the boat, route and conditions.
Here we explain product meaning without selecting a commercial model or operational recipe.
A distribution can be summarised by median, mean or percentiles. The median is a central value of the ordered list: at least half the values are less than or equal to it and at least half are greater than or equal to it; it need not equal the mean.
A percentile identifies a distribution position under the stated method. A set with two distinct groups can have a mean between them without any nearby scenario.
Distribution shape therefore adds information that one number can hide.
Forecast verification relates predictions to observations and the defined event. A well-interpreted probability describes a set of situations rather than requiring every individual forecast to produce its most likely outcome.
Observation quality matters in that comparison too. Application popularity, detailed colours or agreement between services therefore do not replace product and source evaluation.
- A model starts from an estimate.
- Spread describes possibilities, not every error.
- More resolution or decimal places do not guarantee certainty.
The concept in a few words
Ensemble forecast
Set of calculations exploring differences in initial conditions and/or model to represent possible developments.
Sources and references
- Forecast User Guide — Section 5, Ensemble rationale and construction ↗
ECMWF · Initial-analysis error, model deficiencies and ensemble rationale.
Enduring uncertainty concepts only; no member count, resolution, current product configuration or operational guarantee.
Checked on - Quantifying forecast uncertainty ↗
ECMWF · Initial conditions and model uncertainty.
Page contains older configuration details not imported; only the two uncertainty families used.
Checked on
Keep discovering
The next piece of the puzzle
Discuss this concept
Loading the conversation…