By insideSail
Automated technical check · version 1 ·
Pressure and isobars: read the quantity before the forecast
hPa, millibars and equal-pressure lines: first vocabulary for a weather chart.
In this guide
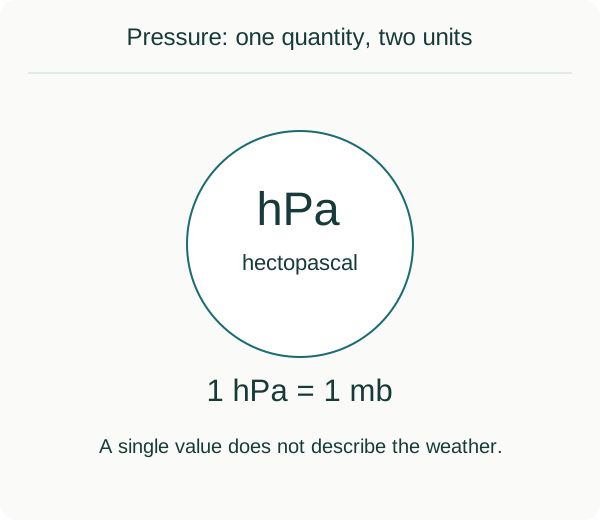
Original schematic illustration. Read the explanation and limitations in the lesson.
insideSailOriginal insideSail artwork — all rights reservedEnlarge the diagram
A pressure chart organises numbers in space. It is not a photograph of a wall in the air: a line represents equal values. When reading a map, look for chart type, its time reference and unit. These three labels come before interpreting the weather.
Compare compatible references
Station pressure and pressure reduced to mean sea level are presented for different purposes. Comparing numbers without knowing that reference can create an apparent difference. In a data catalogue, preserve the definition rather than merely copying the displayed number.
High and low pressure describe relationships within the surrounding field. One isolated number does not summarise weather development. Context includes other variables and changes through time. The aim here is recognising what a caption needs to state before studying systems and fronts.
- Quantity and unit
- Vertical reference of values
- Date/time and analysis or forecast
The concept in a few words
Atmospheric pressure
A quantity represented in hPa or millibars in the cited weather sources; it needs a reference and time.
Sources and references
- High and low pressure ↗
Met Office · Pressure, hPa and isobars
Version: Institutional page. Jurisdiction: International.
Checked on - How we measure atmospheric pressure ↗
Met Office · Station level versus mean sea-level pressure
Version: Institutional page. Jurisdiction: International.
Checked on - Marine forecast glossary ↗
Met Office · Wind direction convention; pressure units
Version: Institutional page. Jurisdiction: International.
Checked on
Discuss this concept
Loading the conversation…