By insideSail
Automated technical check · version 2 ·
Scale, symbols and soundings
More screen enlargement does not mean more source information.
In this guide
A scale of 1:25,000 means one unit on the document represents 25,000 units of the same kind on the ground, at the stated scale reference. A 1:25,000 chart is larger scale than 1:100,000: its denominator is smaller and the same physical area occupies more paper.
“Large scale” refers to the representation ratio, not the size of the region covered.
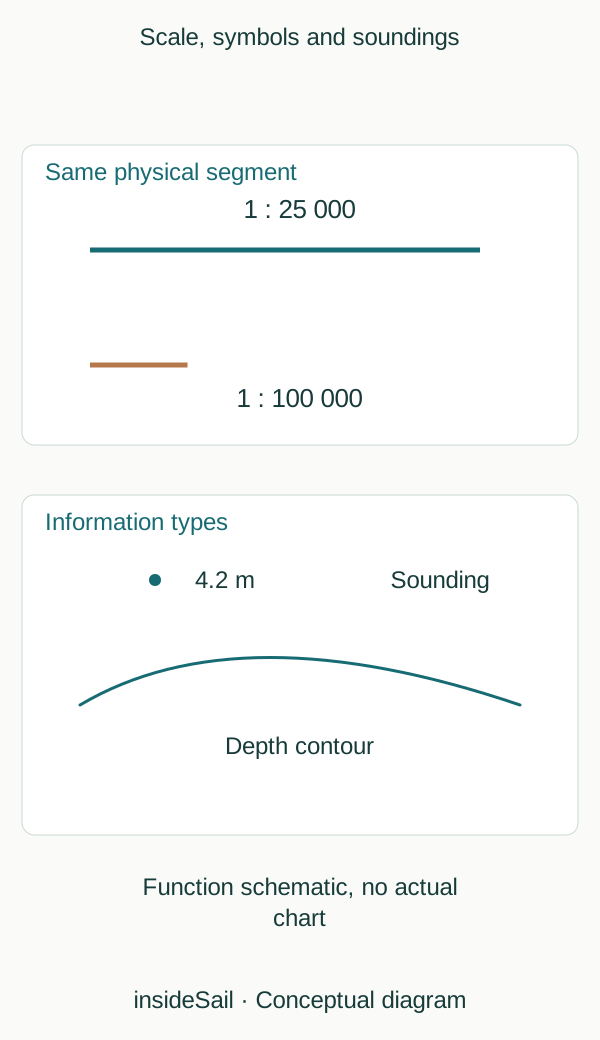
Teaching schematic not to scale; without local data or operational approval.
insideSailOriginal insideSail artwork — all rights reservedEnlarge the diagram
Selection is not physical disappearance
A small-scale representation selects details to remain legible. An individual sounding may be absent, while two features may be generalised into a simpler shape.
Enlarging that representation does not recover what the source omitted. On screen, zoom changes presentation; moving to another dataset or compilation scale changes information.
They may happen together, but they are not the same operation.
A sounding is a depth referred to the chart’s vertical datum. Its unit must be known: metres, feet and fathoms are not interchangeable.
Depth contours connect similar values; a contour does not assert that every space between two lines was continuously and precisely measured. Hydrographic origin, survey age and survey quality are separate from symbol thickness or sharpness.
Symbols have standardised meanings and require context: abbreviations, notes and qualifications form part of the reading. This lesson does not reproduce an official symbol plate or invent a false chart.
Its diagram distinguishes numbers, contours and text by function. Applied interpretation of a hazard, restriction or available depth needs the current legend and information for the actual document.
A 5 m contour and an isolated 4.2 m sounding are different information forms. The contour organises a depth region; the sounding supplies a value at a position.
Number density can vary through selection and data availability. An absent number between two values does not justify freely interpolating a flat bottom.
Bathymetry can contain small structures simplified by presentation or unresolved by survey.
Graphic precision has a physical dimension. At local scale 1:100,000, 0.5 mm corresponds to 50 m; at 1:25,000, it corresponds to 12.5 m.
These values illustrate proportion rather than actual chart accuracy. They explain why pointing to a fine line’s centre does not yield infinite precision.
Symbol geometry, assigned location and hydrographic quality are separate layers.
- Larger scale means a smaller denominator.
- Zoom does not restore omitted data.
- A sounding needs units, datum and hydrographic context.
Concepts in this lesson
Chart scale
Ratio between represented and physical dimensions at the stated reference.
Chart sounding
Depth value referred to a chart’s vertical datum.
Sources and references
- Cartografia náutica ↗
Instituto Hidrográfico · Description of chart content and paper, ENC and IENC formats.
Portuguese hydrographic context, not an asserted legal requirement for every leisure vessel.
Checked on - Regulations for International (INT) Charts and Chart Specifications of the IHO — S-4 ↗
International Hydrographic Organization · Edition 4.10.0, March 2026; B-200 mathematical framework; B-300 topography; B-400 hydrography, including soundings and depth contours.
Conceptual facts and standards locator only. No IHO text, chart symbology plate or diagram is reproduced.
Checked on - Nautical cartography ↗
NOAA Office of Coast Survey · Map projections; chart scale; cartographic generalisation.
Projection and scale concepts only; US paper-chart policy is not applied to Europe.
Checked on
Keep discovering
The next piece of the puzzle
Discuss this concept
Loading the conversation…