By insideSail
Automated technical check · version 2 ·
What a nautical chart represents
Depths, references and selected information in a specialised document.
In this guide
A nautical chart selectively represents information relevant to navigation. It includes depths, hazards, coastal configuration, aids to navigation and other features, with its own references and symbols.
It is more than a tourist map with the sea coloured in. Reading begins with document identity: area, producer, edition, scale, projection, units and references.
These fields explain how drawn features relate to physical space.
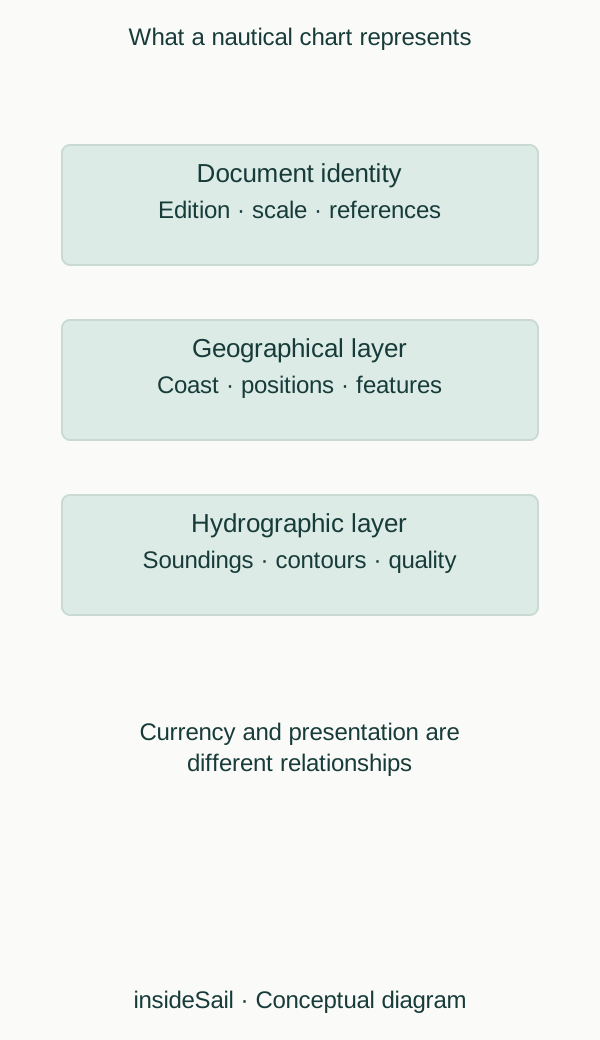
Teaching schematic not to scale; without local data or operational approval.
insideSailOriginal insideSail artwork — all rights reservedEnlarge the diagram
Data, presentation and updating
Soundings are depth values relative to the stated vertical reference, not a promise of constant water depth. Depth contours connect similar depths and help represent seabed form.
Coastline, conspicuous features and aids to navigation serve another function: they connect observations with cartographic information. A chart combines these layers without removing the need to understand each one.
An edition identifies a body of information at a particular state. Updates may incorporate subsequent changes: an aid has moved, restrictions have changed or new hydrographic information has become available.
“Digital” describes a medium; it does not mean “up to date”. A file can be old, distribution can omit the latest update and a system can display a different layer from the one assumed.
Scale requires selection: details may be simplified or omitted to preserve legibility. Hydrographic quality also varies with source survey and area.
A clean line therefore does not mean the seabed was measured with uniform precision. The scale lesson develops generalisation, while electronic systems explain raster and vector organisation.
This lesson’s figure is an original conceptual legend, not a position, official chart or navigable area.
A chart also separates position from description. A feature can have geometry and attributes: identity, nature, height or another property.
A note can qualify a value or refer to a publication. Reading only the most visible number removes meaning.
In a conceptual example, “known depth”, “depth awaiting verification” and “area without sufficient survey” are not three graphic ways of stating the same thing; they describe different states of knowledge.
Companion publications can explain conditions and detail that do not fit on a chart. Graphic space is limited, and generalisation is part of production.
A chart is therefore not a complete inventory of services, instructions or administrative information. Combining documents gathers distinct functions: geographical representation, textual description and change notices.
Recognising those functions clarifies “which document contains this information?” without guessing what an absence means.
- Read chart identity before individual features.
- Digital format does not guarantee currency.
- Quality and detail are not uniform.
Sources and references
- Cartografia náutica ↗
Instituto Hidrográfico · Description of chart content and paper, ENC and IENC formats.
Portuguese hydrographic context, not an asserted legal requirement for every leisure vessel.
Checked on - Regulations for International (INT) Charts and Chart Specifications of the IHO — S-4 ↗
International Hydrographic Organization · Edition 4.10.0, March 2026; B-200 mathematical framework; B-300 topography; B-400 hydrography, including soundings and depth contours.
Conceptual facts and standards locator only. No IHO text, chart symbology plate or diagram is reproduced.
Checked on - Nautical cartography ↗
NOAA Office of Coast Survey · Map projections; chart scale; cartographic generalisation.
Projection and scale concepts only; US paper-chart policy is not applied to Europe.
Checked on
Keep discovering
The next piece of the puzzle
Discuss this concept
Loading the conversation…