By insideSail
Automated technical check · version 2 ·
Weather probabilities: reliability, frequency and sample
A probabilistic forecast is assessed across comparable cases, not one outcome.
In this guide
A 20% probability does not promise that a phenomenon occurs exactly once in each successive five-day block. It describes a claim about a defined event and available information.
Assessing that claim requires comparing many similar cases with observations. This lesson develops verification after ensemble members, spread and percentiles.
All following data are invented rather than measurements of an actual service’s performance.
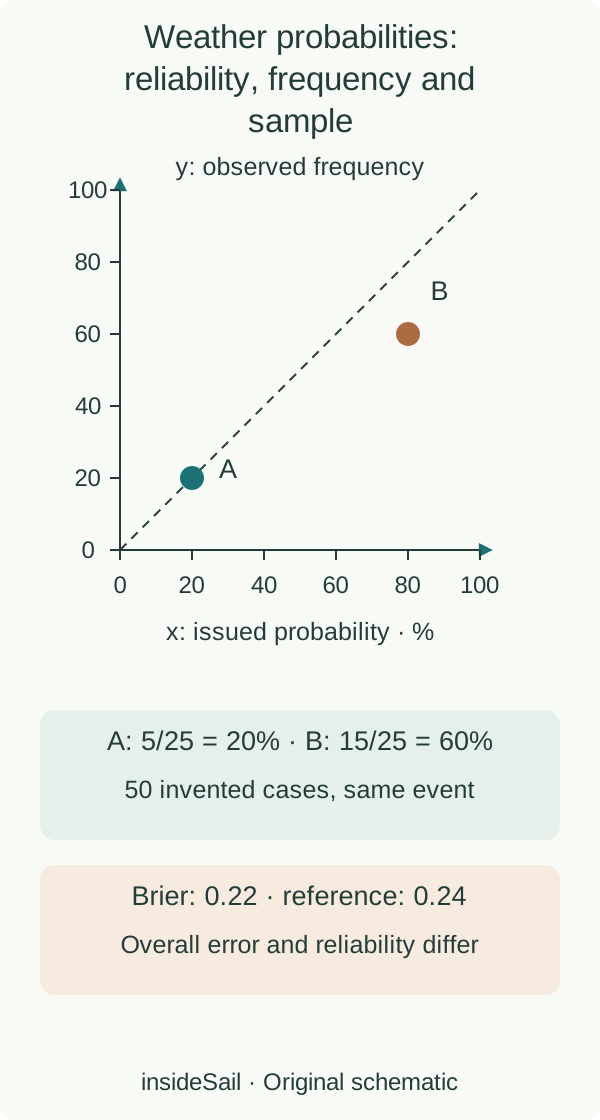
Original diagram with fictional data or an idealised process. Not a forecast or navigation decision.
insideSailOriginal insideSail artwork — all rights reservedEnlarge the diagram
Define the event before counting
We choose an abstract event E, defined beforehand using a fixed variable, place, interval and criterion. Each outcome is 1 when E occurred and 0 when it did not.
Three hours and twenty-four hours do not define the same event. A point observation and an area average differ too.
Changing the definition after learning the outcome would make the comparison inconsistent.
| Fictional group | Issued probability | Cases | E occurred | Frequency |
|---|---|---|---|---|
| A | 20% | 25 | 5 | 20% |
| B | 80% | 25 | 15 | 60% |
In group A, observed frequency matches the issued probability. In B, it is lower.
A reliability diagram places forecast probability on its horizontal axis and observed frequency on its vertical axis. Points are (20%,20%) and (80%,60%).
The diagonal represents equality. The second point reveals a mismatch in this sample group, without establishing behaviour at other locations, seasons or probabilities.
An assessment retaining every forecast
For a binary event, the Brier Score averages (p−o)², where p is probability between 0 and 1 and o is outcome 0 or 1. It has no physical unit; lower values represent smaller error under this measure.
It retains each case’s probability instead of first converting everything into a yes/no forecast. Other performance measures exist: one calculation is not a universal ranking.
In the same sample, E occurred 20 times in 50: overall frequency 40%. A fictional reference issuing 40% for every case gives BS=[20×0.6²+30×0.4²]/50=0.24.
The two-group system scores slightly lower despite its mismatch in group B. Overall error and group reliability therefore answer different questions.
This reference was built retrospectively from the sample itself, not as independent validation of an actual forecast.
Do not confuse agreement with information
Always issuing a stable population’s frequency can give good overall agreement without distinguishing more and less likely situations. Issuing values near 0 and 1 makes forecasts more extreme without ensuring correctness.
Reliability relates probabilities to frequencies; ability to distinguish situations and distribution of issued values add other dimensions. Graph appearance or ensemble-member count cannot establish these properties.
Small samples fluctuate and can contain mutually dependent cases. One success does not prove calibration; one occurrence assigned low probability does not refute it.
Case selection, observations and event definition need to be stated. We learn to evaluate probabilistic claims without converting percentages into acceptable sailing conditions or replacing appropriate weather products.
- Assess many cases with the same event definition.
- Reliability and overall error are different assessments.
- A fictional sample neither certifies nor recommends an actual model.
Sources and references
- Separating the signal from the noise ↗
ECMWF · 2026 science blog; A shift in perspective: information, noise, reliability and resolution, selected reliability paragraph.
Official page directly read. Used only to distinguish probability reliability from other performance attributes; specialised new decomposition is not taught or asserted as a universal ranking.
Checked on - Forecast User Guide — 12.B Statistical Concepts, archived version 15 ↗
ECMWF · Page explicitly identifies an old version, last updated 10 February 2022; The Reliability Diagram, Sharpness and Brier Scores sections.
Archived official page directly read. Enduring verification definitions only, no assertion of current model specification. Current-version link was unavailable; all sample counts and artwork here are original.
Checked on
Keep discovering
The next piece of the puzzle
Discuss this concept
Loading the conversation…