By insideSail
Published without technical review · version 2 ·
When several layers agree and remain wrong
Data, reference, timing and display errors have different effects.
In this guide
A system can present a stable, coherent image while receiving unsuitable information. Boat position, charted-feature positions and their presentation have different origins.
Overall quality cannot be deduced from screen sharpness alone. This lesson analyses dependencies and limitations rather than supplying an underway failure-response procedure.
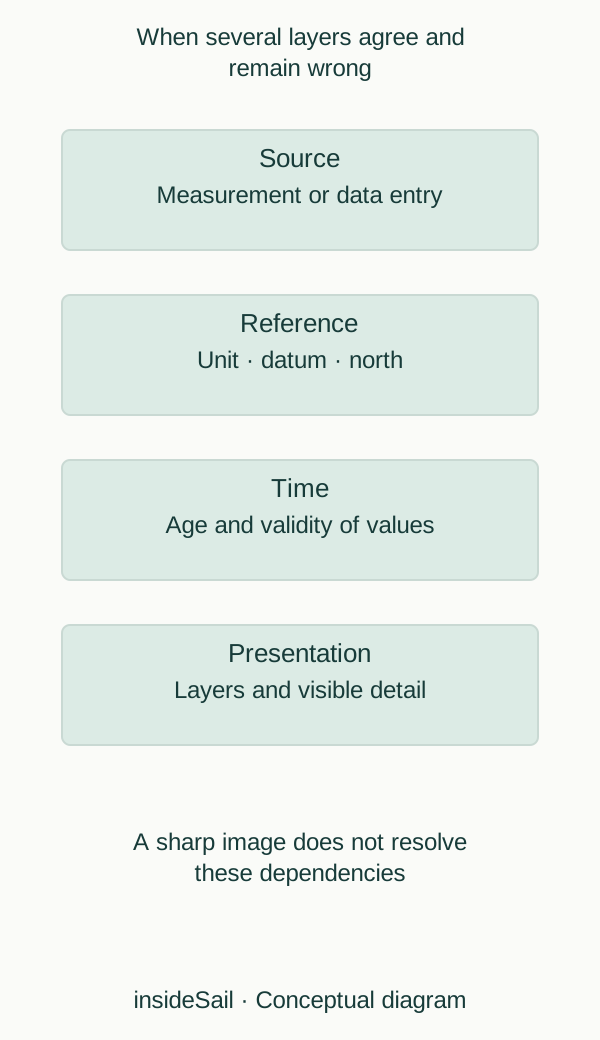
Teaching schematic not to scale; without local data or operational approval.
insideSailOriginal insideSail artwork — all rights reservedEnlarge the diagram
Four problem layers
At source, signals can be obstructed, reflected or disturbed; measurements and entered information can be wrong. At reference level, a value can be interpreted with unsuitable units, datum or north.
At timing level, old information can be received or displayed without being recognised as old. At presentation level, detail can be hidden or an image enlarged beyond its source information.
These mechanisms differ despite potentially producing the same apparently displaced point.
Errors can be shared across displays. Two devices sharing antenna, receiver, power or database are not independent at every layer.
A second presentation can make information easier to read, but agreement does not prove the source correct. Independence should be described component by component: different data at one layer may still depend on the same origin elsewhere.
Depth quality, coverage and generalisation also contribute chart uncertainty. A software update can change display without creating a new survey.
A service may indicate absent quality information; that differs from confirming high quality. Useful confidence identifies its layer and evidence.
The aim is to understand how errors enter a result, without substituting this lesson for documentation, training or local assessment.
Calculation can produce decimal places even from rounded inputs. An operation on an approximate position may display distance to 0.001 nautical miles.
Display resolution is the spacing of presented values; accuracy relates to the real quantity. Many digits can coexist with poor accuracy, while fewer digits may suit a stated purpose.
A representation may retain its last received value after fresh data stop, depending on the system. Graphic continuity and measurement continuity are therefore different questions.
A timestamp describes that difference without guessing from symbol stability. Previously downloaded layers and active data links also have different time origins.
No universal alarm or application behaviour is assumed here.
- Sharpness is not accuracy.
- Agreement can result from a shared origin.
- Chart quality and position quality are different components.
Sources and references
- Boat Crew Handbook — Navigation and Piloting, BCH16114.3 ↗
United States Coast Guard · Chapter 3 C.1–C.2 pp.3-28–3-29; C.6–C.9 pp.3-35–3-49; G.2 pp.3-130–3-131.
Physical sensor/display relationships only. Historical accuracy, legal carriage and operational claims excluded.
Checked on - Facts About Electronic Charts and Carriage Requirements — S-66 ↗
International Hydrographic Organization · Edition 2.0.0, October 2024; §§1.4, 2.2–2.5, 2.11–2.13; section 6 on safe use and section 7 on depth accuracy.
Format/system distinctions only. ECDIS and leisure chartplotters are not presented as legally equivalent. No protected prose or figures reproduced.
Checked on - GPS accuracy — archived official explainer ↗
GPS.gov · User accuracy; signal-in-space accuracy; obstruction, geometry and receiver effects.
Archive identifies itself as no longer updated since February 2025. Used for enduring error categories, never a current accuracy guarantee.
Checked on
Keep discovering
The next piece of the puzzle
Discuss this concept
Loading the conversation…