By insideSail
Published without technical review · version 2 ·
Plot a position and measure a leg, step by step
Two worked constructions connect coordinates, tools and units.
In this guide
After recognising latitude, longitude and scale, we need to move from vocabulary to construction. We will mark a point on a teaching angular grid, then measure a leg on a separate local plan.
These are independent drawings, without coastline, depths or dangers. Neither is a navigation chart.
The purpose is to understand each geometrical operation and check the result; using an actual chart adds document identity, updates, quality and nautical assessment.
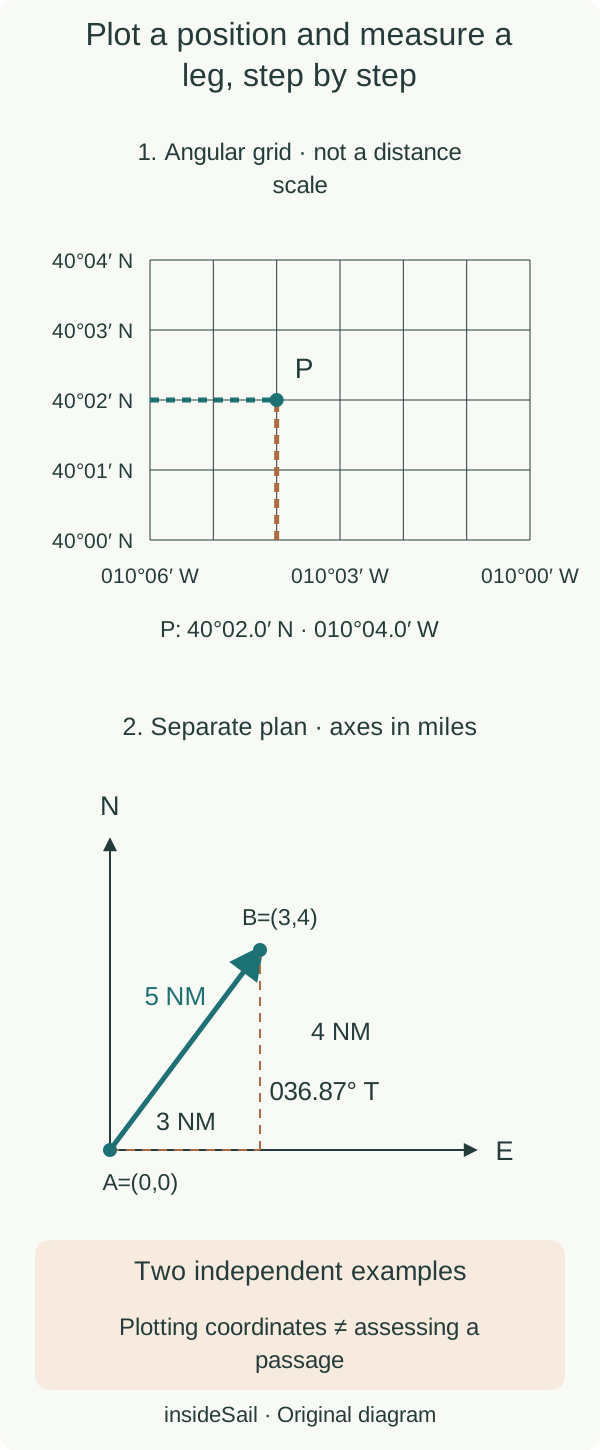
Original fictional constructions for learning. Navigation review pending.
insideSailOriginal insideSail artwork — all rights reservedEnlarge the diagram
1. Locate latitude and longitude
Fictional point P has latitude 40°02.0′ N and longitude 010°04.0′ W, under a hypothetical horizontal reference shared by grid and record. First find 40°02.0′ on the latitude margin.
A horizontal line through that value fixes latitude but still permits many longitudes. Next find 010°04.0′ on the longitude margin and draw its vertical line.
Their crossing is P. West values decrease towards the right in this figure: moving east approaches the zero meridian.
Parallel rulers or a plotting triangle can transfer a direction without rotating it; dividers transfer a span. Check P by reversing the operation: transfer the point to each margin and recover both coordinates with their hemispheres.
Confirming that it looks “roughly right” is insufficient. Check whether minor divisions indicate tenths of a minute or seconds too.
This angular grid has no uniform geographical distance scale: it teaches coordinates rather than ruler-based distance measurement.
2. Measure course and distance in a separate construction
The second panel uses local axes, true north upwards and east rightwards, with equal scales on both axes. A=(0,0) and B=(3,4), in nautical miles.
Join A to B with a ruler. Place the protractor’s angular zero at north, preserve its orientation and read clockwise to A→B.
The result is approximately 036.9° T. A school protractor starting from east may show 53.1°: that is the complementary angle rather than the course measured from north.
For a segment on an actual Mercator chart, preserve the dividers’ span between endpoints and transfer it to the latitude scale near the segment’s latitude; read the interval on the appropriate scale. The minute–mile relationship is the customary chartwork approximation, while the international mile remains exactly 1852 m.
Do not treat longitude minutes as miles. Measuring a stretched screenshot can distort both lengths and angles.
The construction supplies a plotted position and a leg’s geometry. It has neither determined a heading to steer nor checked depths, obstructions or manoeuvring space.
That distinction lets us learn the complete drawing operation without presenting a permitted passage. Keep coordinates, reference, direction, course, distance and origin as separate fields in the record.
- Read hemispheres and subdivisions before marking.
- Recover coordinates to check the point.
- Measure angle from north and distance against a compatible scale.
Sources and references
- Boat Crew Handbook — Navigation and Piloting, BCH16114.3 ↗
United States Coast Guard · December 2017; Chapter 3 E.3–E.5, printed pp.3-82–3-86; E.8.c–E.8.d.2, pp.3-89–3-92; D.12, pp.3-69–3-73.
Selected plotting geometry only. Erroneous numerical statements in E.6/E.7/E.8 and the G.13 current example are expressly excluded. No US procedural standard or artwork reproduced.
Checked on
Keep discovering
The next piece of the puzzle
Discuss this concept
Loading the conversation…