By insideSail
Automated technical check · version 2 ·
Scale, generalisation and quality are different properties
Drawing size, selected detail and confidence in data answer different questions.
In this guide
A chart is an organised representation rather than an exact photograph of the seabed. Three questions help explain it: at what size features were drawn; which information was selected or simplified; and what is known about the quality of the original data.
These concern scale, generalisation and evidence respectively. They share a screen or sheet, but cannot substitute for one another.
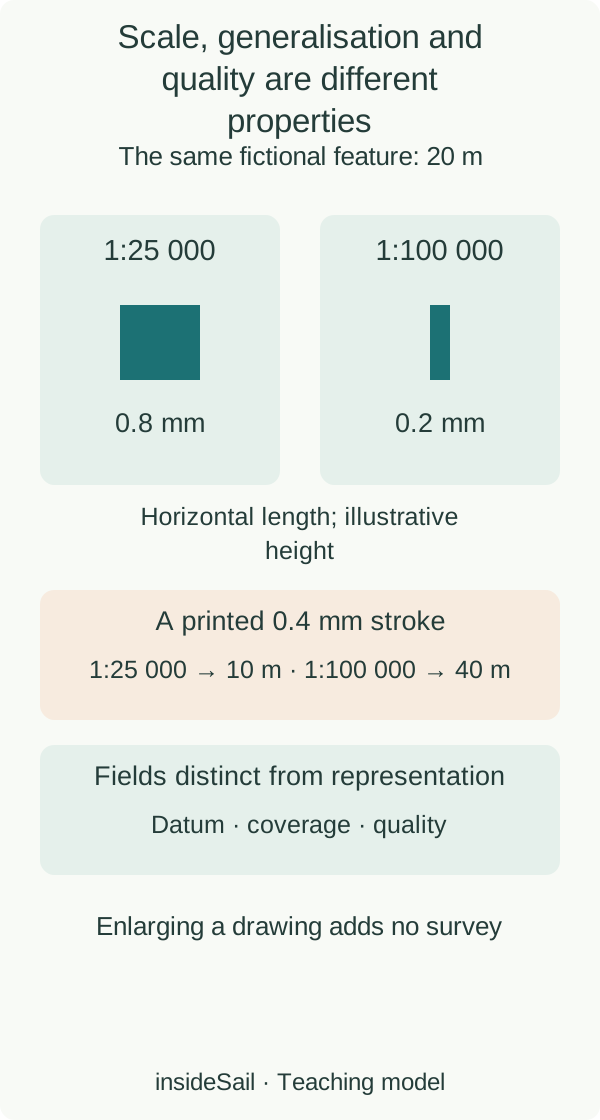
Original schematic; fictional examples and explicit assumptions. Does not represent actual navigation.
insideSailOriginal insideSail artwork — all rights reservedEnlarge the diagram
What does a stroke occupy?
On a planar representation with constant local scale 1:N, a paper length multiplied by N gives its corresponding ground length, using compatible units. A larger denominator means a smaller scale.
A stroke needs width to be visible; that width occupies a represented area too. Ink makes a line legible, but its printed thickness declares neither an object’s physical width nor the accuracy of its position.
Selection is not invention
Cartographic generalisation can reduce a line’s vertices, group information or replace a small area with a symbol. It is more than shrinking everything in a photocopier.
The result must remain intelligible for the representation’s purpose. Consequently, visual space around a symbol cannot establish the complete extent of the feature represented.
A symbol and proportional geometry perform different functions.
Zooming may enlarge the drawing already present. Loading another dataset, compiled with different detail, is a separate operation.
They can look similar, although only the second introduces new information. Magnifying an imprecise coordinate retains its ground uncertainty; it merely changes the number of pixels occupied.
Neither a smooth curve nor a crisp digit reveals the measurement’s origin.
Horizontal, vertical and coverage
A sounding’s position and depth value are different quantities. The former can have a horizontal reference; the latter uses an identified vertical datum.
A well-measured depth does not establish that it was correctly located. Coverage adds another question: how much of the area was actually observed?
Detailed information at some points does not automatically turn the spaces between them into known areas.
IHO S-67 describes these dimensions of quality. This lesson does not turn categories into a clearance table: the teaching point is that scale and quality are not the same attribute.
In an invented record, “scale 1:25,000”, “survey year X”, “position evaluated by method Y” and “vertical datum Z” are complementary fields. Age may matter without independently proving a survey good or bad.
This example uses a planar grid rather than an actual coastline. A projection’s local scale can vary with location; the Mercator lesson treats that geometry.
Understanding representation and evidence differs from deciding an approach, which also involves current information, vessel and conditions.
- Stroke width is neither object size nor uncertainty.
- Generalisation selects a legible representation.
- Scale, datum, coverage and quality need separate fields.
Sources and references
- Boat Crew Handbook — Navigation and Piloting, BCH16114.3 ↗
United States Coast Guard · BCH 16114.3, December 2017; Chapter 3 B.4 printed p.3-13 and B.6 pp.3-23–3-24.
Selected scale and source-quality descriptions read; abstract printed-width example is original, not a route or plotting tolerance.
Checked on - Mariners’ Guide to Accuracy of Depth Information in ENC — S-67 ↗
International Hydrographic Organization · Edition 1.0.0, September 2020; §4.1 printed p.6 / PDF p.11; §5.1.1 printed p.14 / PDF p.20; Annex B printed p.20 / PDF p.26.
Selected distinctions between data quality, compilation/display scale and point representation directly read. No CATZOC clearance table, operating instruction or source artwork reproduced.
Checked on
Keep discovering
The next piece of the puzzle
Discuss this concept
Loading the conversation…