By insideSail
Automated technical check · version 2 ·
Significant height: one statistic, many waves
Calculate the highest third and distinguish it from the maximum, mean and spectral height.
In this guide
A sea state contains waves of different heights. One number can summarise that diversity without describing every wave.
Significant height is one such statistic, and its definition belongs alongside its value. After recognising height, period and swell, we compare three summaries of one list and explore why significant height is neither an upper limit nor a promise for the next wave.
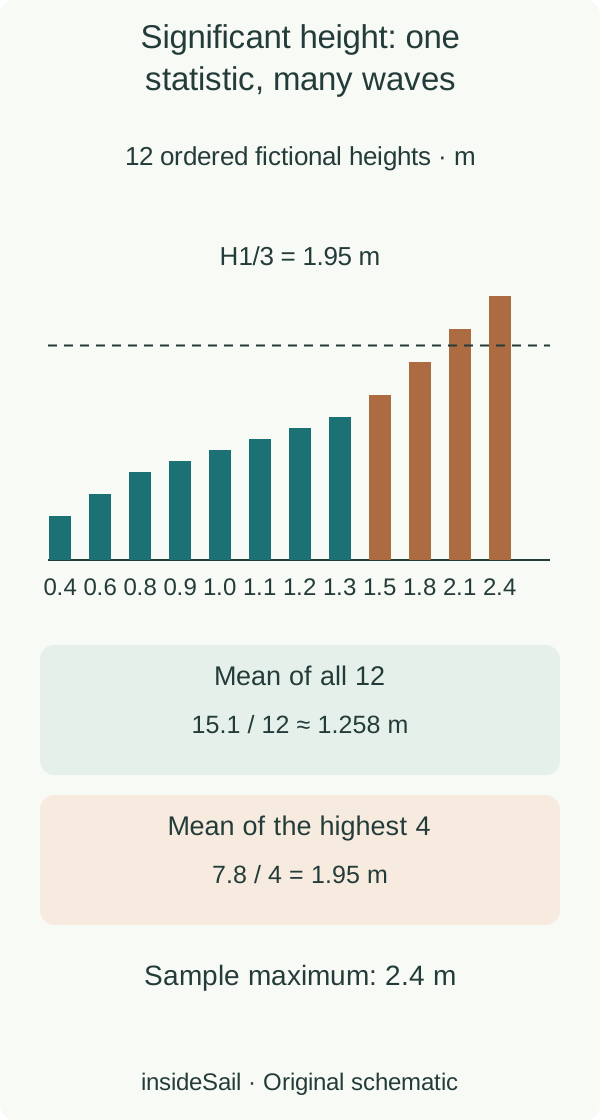
Original diagram with fictional data or an idealised process. Not a forecast or navigation decision.
insideSailOriginal insideSail artwork — all rights reservedEnlarge the diagram
A list constructed for learning
For the time-domain definition H1/3, individual heights are ordered and the highest third is averaged. Each wave’s height measures vertical separation between trough and crest under the chosen identification method.
It is not merely crest elevation above mean level. The following list is already ordered and represents twelve invented waves, with no actual place, time or buoy record.
The twelve waves are not all 1.95 m high. Ten are below that value and two above.
Of the four values in the highest third, two remain below its mean: 1.5 m and 1.8 m. Neither “one third of waves equals Hs” nor “one third exceeds Hs” automatically describes the definition.
A group mean is not an exceedance count. This small list reveals a distinction hidden in a bulletin containing only one number.
Ordering heights also removes temporal order. The highest four can occur together or alternate with smaller waves while retaining exactly the same H1/3.
Both sequences can be constructed from the same twelve numbers without changing sum, mean or maximum. The figure’s horizontal axis contains ordered heights, not seconds: spacing between bars therefore cannot yield a period.
Sequence or time between waves would require additional temporal information.
Another definition, another method
Many products use spectral significant height Hm0. It is calculated as 4√m0, where m0 is surface-elevation variance represented by the spectrum, in m².
The factor 4 belongs to the conventional definition. Hm0 and H1/3 are related, but are not exactly identical operations on a height list.
Method, analysed interval and processing assumptions help explain differences between values.
The relationship in numbers
Hm0 = 4√m0
m0 in m²; Hm0 in m. Not a maximum-height formula.
The maximum depends on the observed set
A longer sample may include a larger wave without invalidating the previous sample’s statistic. It may also span changing conditions, in which case one combined summary loses temporal information.
Twelve values were chosen to make arithmetic legible, not to represent a normal observation duration. Wave count, duration and identification method belong in the record.
Hs alone does not specify wave period, direction or shape. Two sets sharing one summary can have different distributions and components.
A sample maximum is not an absolute ocean maximum; a spectral formula does not determine the greatest impact on a boat. The next lesson opens the spectrum to reveal information a summary omits, keeping application to actual conditions and vessels separate.
- H1/3 averages the highest group; it does not count Hs exceedances.
- Hm0 uses elevation variance, not variance of individual wave heights.
- Hs, mean height and sample maximum are not interchangeable.
Sources and references
- Measurement Descriptions and Units ↗
NOAA National Data Buoy Center · Wave summary and spectral wave data sections: WVHT, DPD, MWD, spectral density and frequency-dependent directions.
Official HTML retrieved directly with HTTP 200; selected wave sections read. Sampling intervals are product-specific, not universal. No live buoy data or missing-value conventions adopted.
Checked on - Nondirectional and Directional Wave Data Analysis Procedures — 02-404(1) ↗
NOAA National Data Buoy Center · Marshall D. Earle, January 2003; §3.2.9 printed pp.7–9 / PDF pp.11–13; §3.2.10 printed pp.9–11 / PDF pp.13–15; Appendix A printed p.42 / PDF p.46.
Official PDF retrieved directly with HTTP 200 and selected pages read. Historical technical report used for enduring definitions, not current instrument processing or numerical performance guarantees. No reproduced source diagrams.
Checked on - How are significant wave height, dominant period, average period, and wave steepness calculated? ↗
NOAA National Data Buoy Center · Opening significant-height paragraphs: WVHT=4√m0, m0 spectral sum; dominant period as inverse peak frequency.
Official HTML retrieved directly with HTTP 200 and read after web extractor 403. Only definitions/formulae used; current band limits, steepness algorithm and operational interpretation excluded.
Checked on
Keep discovering
The next piece of the puzzle
Discuss this concept
Loading the conversation…