By insideSail
Automated technical check · version 2 ·
Wave spectra: frequency, energy and direction
A band’s area tells more than the isolated height of a graph’s peak.
In this guide
A spectrum describes how surface variability is distributed across frequencies and, when directional information exists, across directions. It is another view of the sea state rather than a picture of waves arranged in space.
A frequency graph’s horizontal axis represents oscillations per second; its vertical axis may represent variance density. A peak’s height on paper is not a wave height in metres.
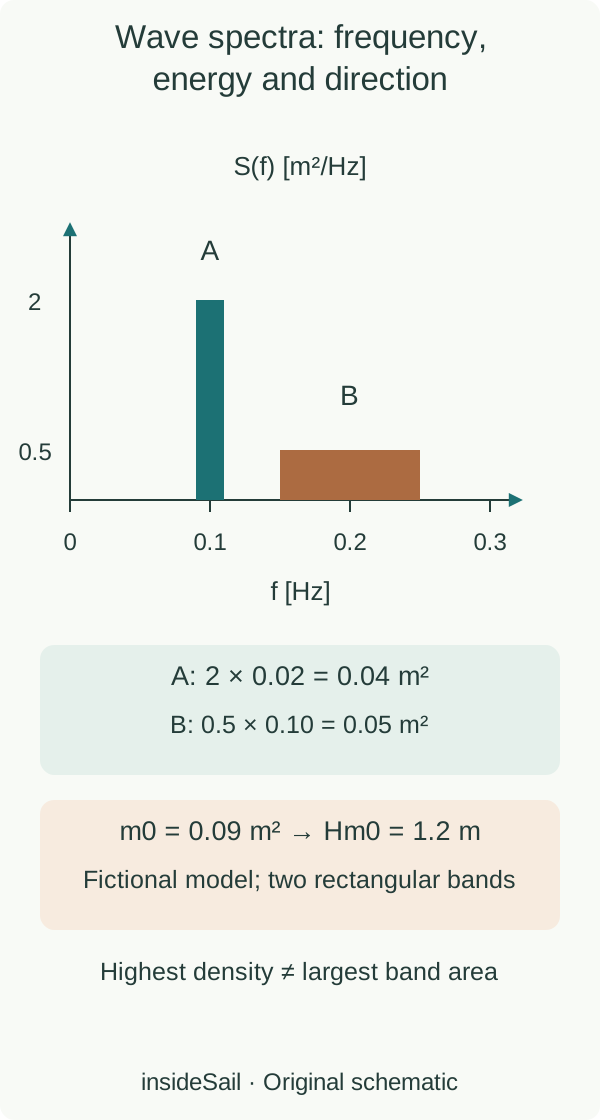
Original diagram with fictional data or an idealised process. Not a forecast or navigation decision.
insideSailOriginal insideSail artwork — all rights reservedEnlarge the diagram
Period and frequency are reciprocals
A frequency of 0.10 Hz means 0.10 cycles per second, or one cycle in 10 s. At 0.20 Hz, the period is 5 s.
T=1/f requires positive frequency and the same time reference. Transforming a frequency axis into a period axis changes interval spacing: relabelling numbers is insufficient.
Transforming a density also requires respecting the axis variable and its units.
In a non-directional elevation spectrum, S(f) may use m²/Hz. Multiplying a band’s density by its width in Hz gives a contribution in m².
Adding contributions approximates total variance m0. A tall narrow band can therefore contribute less than a low broad one.
Reading only the highest point confuses density per unit frequency with the integrated quantity in a band.
| Fictional band | Centre f | Width Δf | S(f) | S×Δf |
|---|---|---|---|---|
| A | 0.10 Hz | 0.02 Hz | 2 m²/Hz | 0.04 m² |
| B | 0.20 Hz | 0.10 Hz | 0.5 m²/Hz | 0.05 m² |
Height summaries do not add directly
If two components are treated as uncorrelated in a statistical model, their variances can add. Their Hm0 heights do not follow the same addition rule because they depend on a square root.
In a separate example, components with Hm0 of 2 m and 4 m have m0 of 0.25 m² and 1 m². Combined Hm0 is 4√1.25≈4.472 m, not 6 m.
The correlation assumption matters: this neither adds two observed crests nor calculates an instantaneous wave.
Direction can depend on frequency too
Components with different periods can arrive from different directions. A directional spectrum retains that distribution; a “mean direction” arrow compresses it.
Direction associated with the peak band need not equal a mean across the whole spectrum. FROM and TO conventions also differ: here, maritime direction FROM 315° identifies a north-west origin; corresponding propagation is TO 135° under the same true reference.
A buoy-estimated spectrum depends on a finite record, sensor response and processing. It contains neither the entire surface nor the exact sequence of future waves.
Our two-band arithmetic is transparent integration for learning units and summaries, not a forecast algorithm. Applied interpretation of crossing seas, current or vessel response needs more context than this statistical representation.
- Frequency and period need units and a frame.
- Band area = density × width in this model.
- Peak period and mean direction compress a richer distribution.
Sources and references
- Measurement Descriptions and Units ↗
NOAA National Data Buoy Center · Wave summary and spectral wave data sections: WVHT, DPD, MWD, spectral density and frequency-dependent directions.
Official HTML retrieved directly with HTTP 200; selected wave sections read. Sampling intervals are product-specific, not universal. No live buoy data or missing-value conventions adopted.
Checked on - Nondirectional and Directional Wave Data Analysis Procedures — 02-404(1) ↗
NOAA National Data Buoy Center · Marshall D. Earle, January 2003; §3.2.9 printed pp.7–9 / PDF pp.11–13; §3.2.10 printed pp.9–11 / PDF pp.13–15; Appendix A printed p.42 / PDF p.46.
Official PDF retrieved directly with HTTP 200 and selected pages read. Historical technical report used for enduring definitions, not current instrument processing or numerical performance guarantees. No reproduced source diagrams.
Checked on - How are significant wave height, dominant period, average period, and wave steepness calculated? ↗
NOAA National Data Buoy Center · Opening significant-height paragraphs: WVHT=4√m0, m0 spectral sum; dominant period as inverse peak frequency.
Official HTML retrieved directly with HTTP 200 and read after web extractor 403. Only definitions/formulae used; current band limits, steepness algorithm and operational interpretation excluded.
Checked on - How are spectral wave data derived from buoy motion measurements? ↗
NOAA National Data Buoy Center · Opening time-to-frequency description; closing directional parameters paragraph.
Official HTML retrieved directly with HTTP 200. Enduring representation idea only; historical sensors/CD-ROM and hardware processing recommendations excluded.
Checked on
Keep discovering
The next piece of the puzzle
Discuss this concept
Loading the conversation…